# Gallery: Scientific Plot Organizer
[](https://www.python.org/downloads/)
[](https://opensource.org/licenses/MIT)
**Create responsive HTML galleries for scientific plot collections. Convert PDFs to PNG, organize plots hierarchically, and generate beautiful static websites.**
## Features
### Core Functionality
- PDF to PNG Conversion using ImageMagick
- Incremental updates only when plot is newer than cached
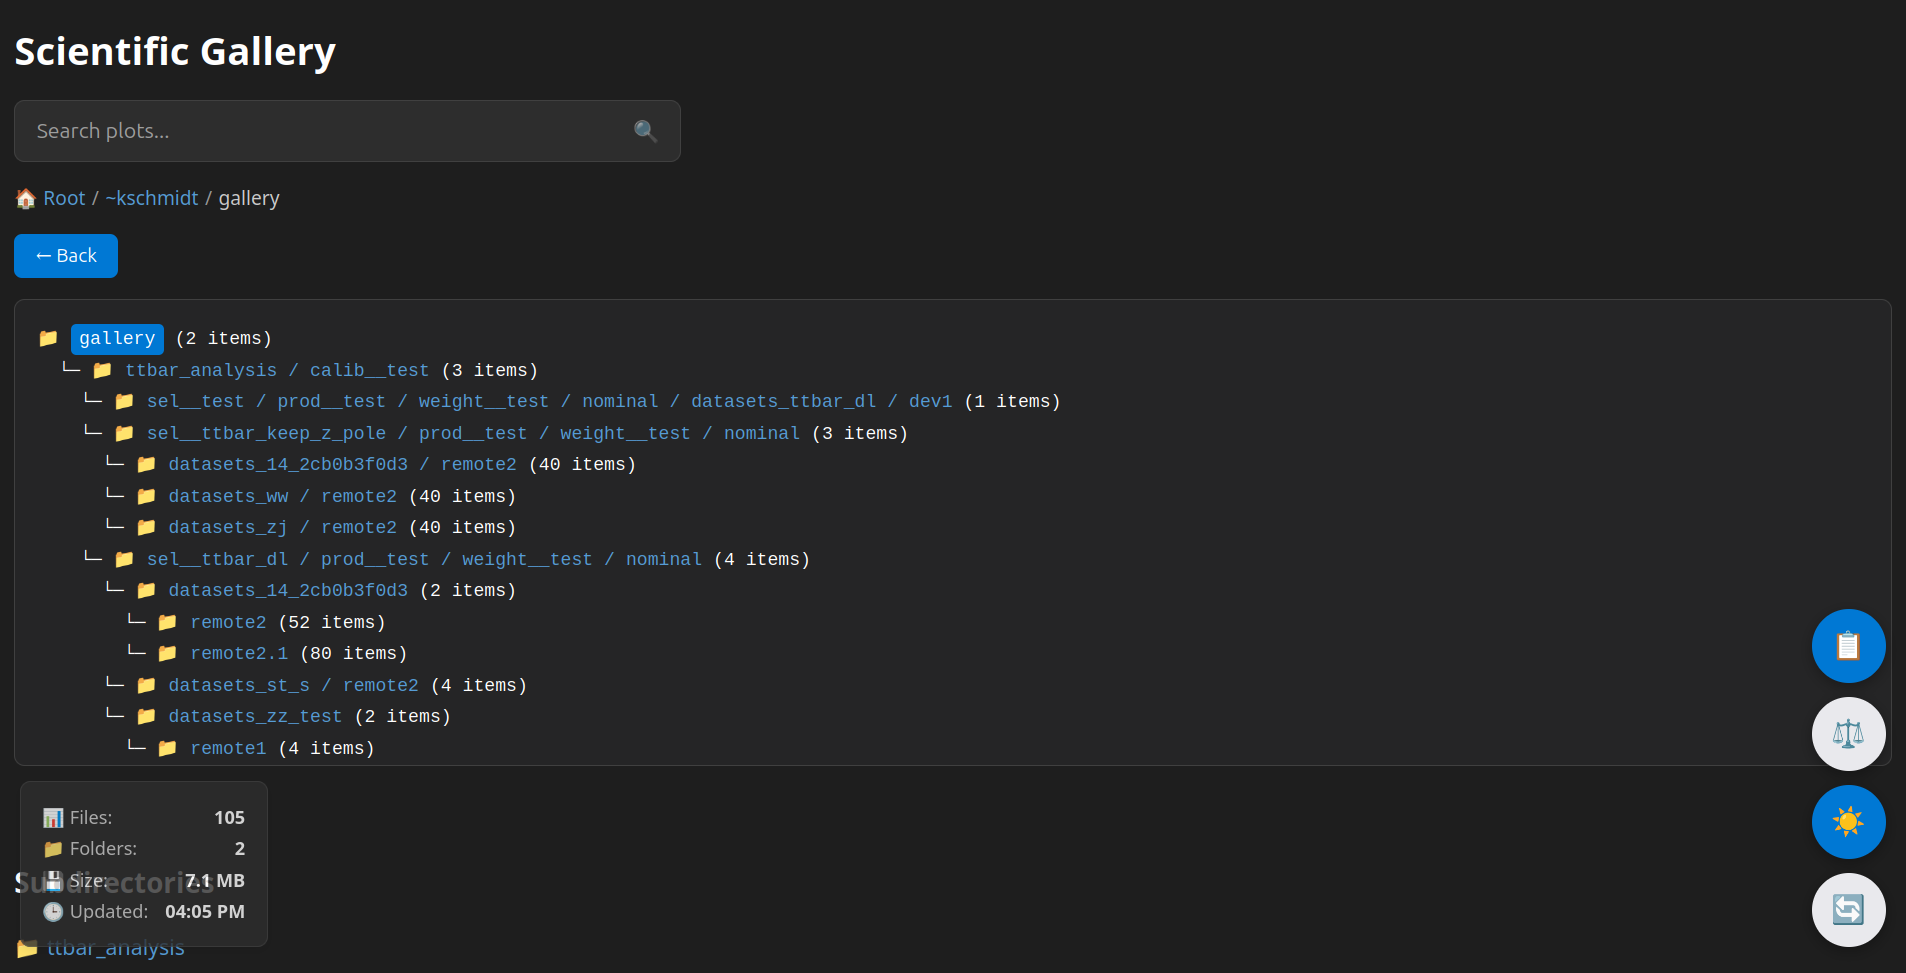
- Responsive design using Jinja2 (also on mobile)
- Support for nested folder structures
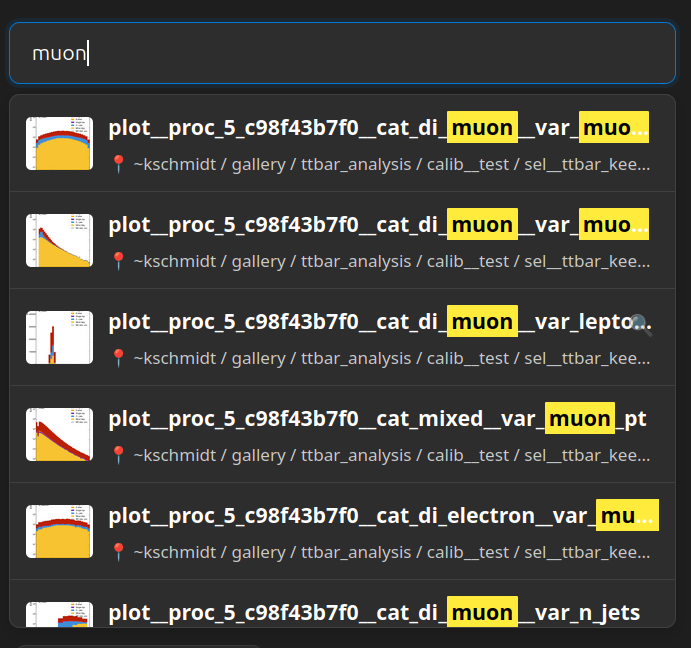
- Search bar
- Breadcrump navigation
### Advanced Features
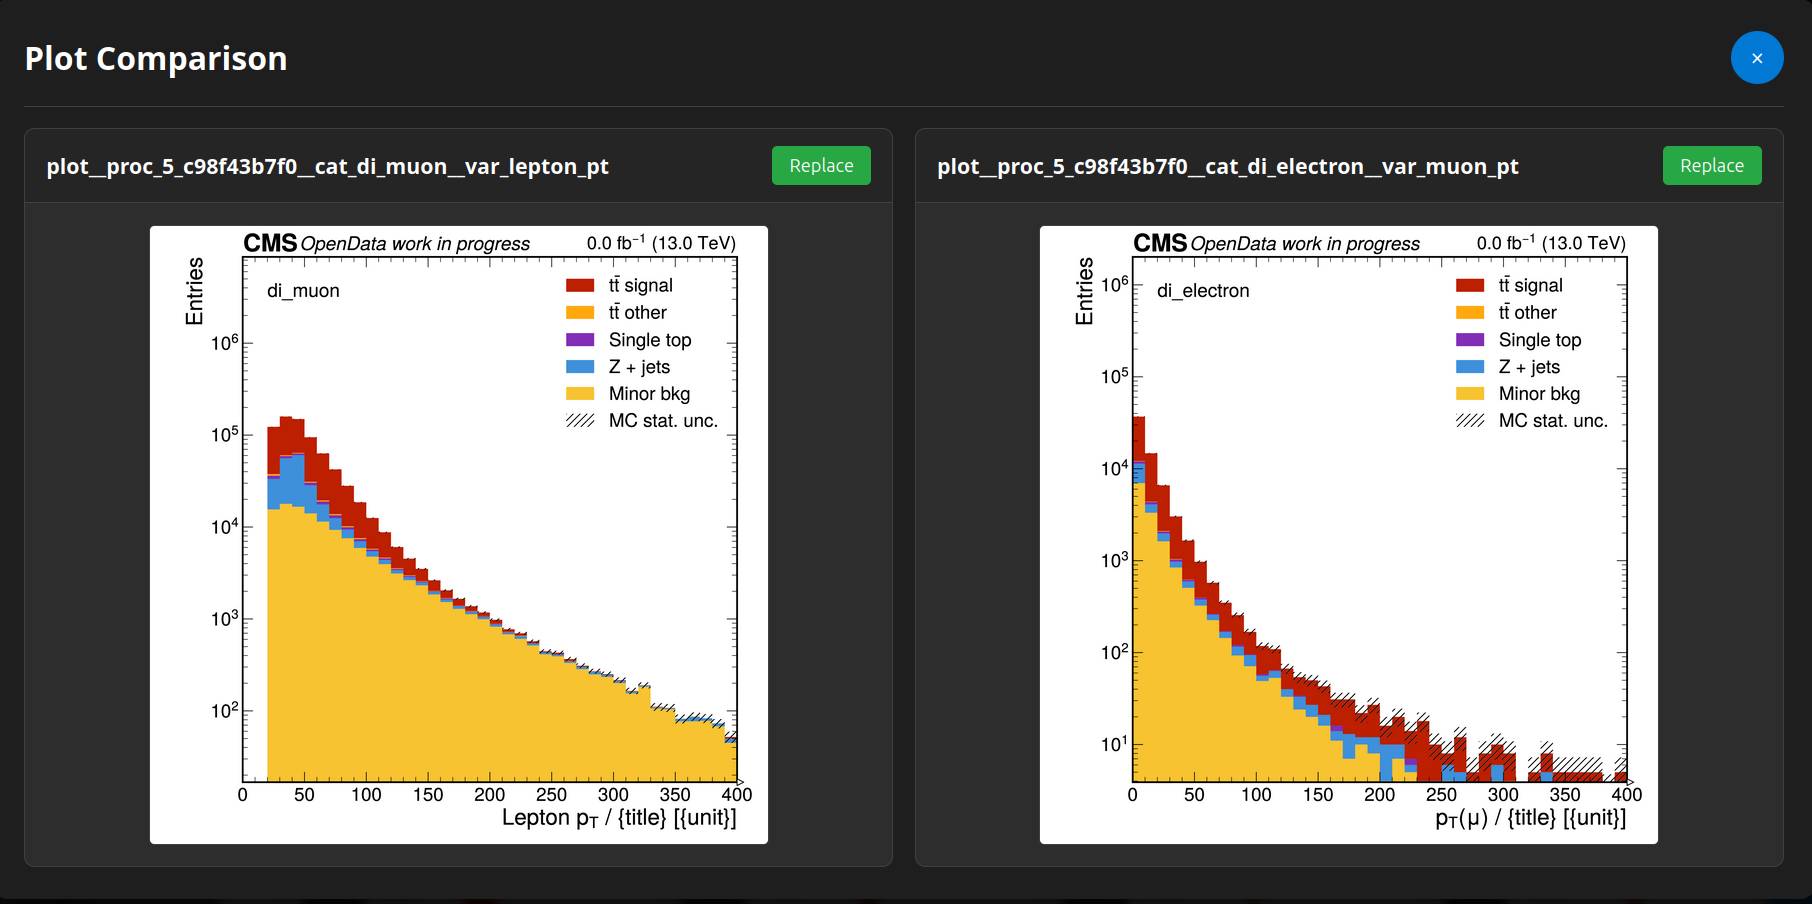
- Compare two plots from the same folder
- YAML/JSON metadata with inheritance and display to properly label each folder
- Recent plots
- Dark and light mode
- Keyboard shortcuts
### Developer-Friendly
- Full python API: `import gallery`
- CLI: `gallery`
- TUI: `gallery tui`
- Config file stored under user `$HOME/.config/gallery`
### Producing Plots (`plotstyle`)
- Companion matplotlib styling toolkit (optional `plotting` extra) for producing figures that look consistent across a thesis and slide deck, ready to drop straight into a gallery source directory — see [Producing Plots with `plotstyle`](#producing-plots-with-plotstyle)
## Installation
### From Gitea
Pip install:
```bash
pip install git+https://git.larsbogner.de/lars/ETPlot
```
Or git clone and `pip install .`. After installation the `gallery` command is available in your shell. Verify with:
```bash
gallery --help
```
### Dependencies
- Python 3.8+
- Python packages are installed automatically by pip (Jinja2, PyYAML, PyMuPDF, Textual, argcomplete, platformdirs)
- [ImageMagick](https://imagemagick.org/) is **optional** — used as a fallback if `PyMuPDF` is not available
### Optional: `plotstyle` (for producing plots)
`plotstyle` is a separate package (its own `plotstyle/pyproject.toml`, a member of this repo's uv workspace) — installing `gallery` alone never pulls in `matplotlib`.
```bash
# Working in this repo (installs gallery + plotstyle + matplotlib together):
uv sync --all-packages
# Just the plotstyle library, standalone:
pip install "plotstyle @ git+https://git.larsbogner.de/lars/ETPlot#subdirectory=plotstyle"
```
`plotstyle` also requires a local LaTeX toolchain (`latex` + `dvipng`) to be installed separately; see [Producing Plots with `plotstyle`](#producing-plots-with-plotstyle).
### Shell Completion (optional)
Install tab-completion for bash/zsh/fish:
```bash
gallery install-completion
```
Then restart your shell or follow the printed instructions to activate it.
## CLI Usage
The `gallery` command has four subcommands: `generate`, `config`, `tui`, and `install-completion`.
### Quick start
```bash
# 1. Set your web output directory
gallery config set paths.web_folder /path/to/your/public_html
# 2. Add one or more plot source directories
gallery config add-source --path /path/to/plots --name my_analysis
# 3. Generate the gallery
gallery generate
```
### `gallery generate`
```bash
# Full regeneration
gallery generate
# Verbose output
gallery generate --verbose
# Clean rebuild (delete output before generating)
gallery generate --clean
# Regenerate a single source only (name will be the basename of the path)
gallery generate --source /path/to/plots
# Use a non-default config file
gallery --config /path/to/config.yaml generate
```
### `gallery config`
```bash
# Show all configuration values
gallery config list
# Show the resolved config file path
gallery config path
# List configured sources
gallery config sources
# Get a single value
gallery config get gallery.png_dpi
# Set a value (all standard YAML types accepted)
gallery config set gallery.png_dpi 300
gallery config set metadata.cache_enabled true
# Add a source directory
gallery config add-source --path /path/to/plots --name my_plots
# Remove a source
gallery config remove-source my_plots
```
### Serving locally
```bash
python -m http.server 8000 -d /path/to/public_html
```
Then open `http://localhost:8000/gallery/` in your browser. You can of course use any port you want to.
## Screenshots
### Main Gallery View
### Metadata Display

### Plot Comparison Tool
### Search Functionality
 ## TUI Usage
The TUI is a terminal user interface built with [Textual](https://textual.textualize.io/). It lets you edit the configuration and trigger generation without leaving your terminal.
```bash
gallery tui
```
## Configuration
The config file lives at `$HOME/.config/gallery/config.yaml` by default. You can point to a different file with `gallery --config /path/to/config.yaml `.
### Config structure
```yaml
paths:
web_folder: "/web/user/public_html" # required
gallery:
plot_root: "gallery" # subdirectory inside web_folder
png_dpi: 400 # thumbnail resolution
sources:
- name: "analysis_results"
path: "/path/to/plots/directory"
- name: "specific_plot"
path: "/path/to/another/directory"
metadata:
cache_enabled: true
inherit_from_parent: true
```
### Metadata Files
Create `metadata.yaml` files in your source directories. Fields are arbitrary and rendered via YAML object interpretation (dict, list, …). Lower-level files override parent values, which is useful for labelling specific experiments.
```yaml
# metadata.yaml
title: "Analysis Results"
description: "Results for my analysis"
experiment: "CMS"
dataset: "Run2_2016_nano_v9"
parameters:
luminosity: "35.9 fb^{-1}"
center_of_mass_energy: "13 TeV"
selection: "baseline"
tags:
- "physics"
- "analysis"
- "cms"
authors:
- "Researcher A"
- "Researcher B"
```
LaTeX formulas are supported in metadata values and rendered with MathJax:
```yaml
formula: "$$E = mc^2$$"
```
## Producing Plots with `plotstyle`
`plotstyle` is a companion matplotlib styling toolkit shipped in this repo (the `plotstyle/` package) for producing the plots you'll point a gallery source at — a KIT (Karlsruhe Institute of Technology) corporate-design color palette, consistent spines/ticks/gridlines, LaTeX text in a modern sans font, and a few building-block functions (figure titles with a parameters subtitle, a same-size colorbar helper, an outside-axes legend, panel labels). It has no code dependency on `gallery` — the two only meet on disk, through the PDF files (and optional `metadata.yaml`) a `plotstyle` script writes into a directory that `gallery` then scans.
Install it with the `plotting` extra (see [Installation](#installation)) and make sure a LaTeX toolchain (`latex` + `dvipng`) is available locally — `plotstyle` always renders text through real LaTeX, there's no fallback.
```python
import numpy as np
import plotstyle as ps
ps.use() # once, before creating any figure
fig, ax = ps.new_figure(
"thesis-single",
title="Measured signal",
params={"N": 512, "seed": 42},
)
x = np.linspace(0, 10, 200)
ax.plot(x, np.sin(x), label="signal")
ax.set_xlabel("Time (s)")
ax.set_ylabel(r"Amplitude $A(t)$")
ps.style_legend(ax, title="Series")
# Save straight into a gallery source directory:
ps.savefig(fig, "/path/to/plots/measured_signal", formats=("pdf",))
```
That PDF (plus an optional `metadata.yaml` next to it, as described above) is exactly what `gallery generate --source /path/to/plots` picks up — `gallery` converts the PDF to a thumbnail PNG itself, so `plotstyle` scripts should stick to `formats=("pdf",)` rather than also producing a PNG.
See `examples/plotstyle_showcase.ipynb` for a fully rendered tour of every function, and `plotstyle/CLAUDE.md` for the full API reference and best practices (aimed at coding agents, but equally useful for humans).
## Shortcuts
| Icon | Button | Function | Shortcut |
|------|---------|--------------------------|----------|
| 🔍 | Search | Real-time plot search | `Ctrl+K` |
| 📋 | Recent | Recently viewed plots | `Ctrl+R` |
| ⚖️ | Compare | Side-by-side comparison | `Ctrl+C` |
| ☀️ | Theme | Toggle dark/light theme | `Ctrl+T` |
## Troubleshooting
### Common Issues
| Issue | (Potential) Solution |
|------------------------------------|----------|
| `gallery` command not found | Run `pip install -e .` from the repo root |
| PDF conversion fails — no renderer | Install PyMuPDF: `pip install pymupdf` (or `apt-get install imagemagick` as fallback) |
| PDF conversion fails — corrupt file | Verify the PDF opens in a viewer; try `pip install --upgrade pymupdf` |
| Permission denied on web dir | Check file permissions and web directory access |
| Metadata not showing | Check YAML syntax with `python -c "import yaml; yaml.safe_load(open('metadata.yaml'))"` |
### ImageMagick memory limits (fallback backend only)
```bash
export MAGICK_MEMORY_LIMIT=2GB
export MAGICK_MAP_LIMIT=2GB
gallery generate --verbose
```
## License
This project is licensed under the MIT License — see the [LICENSE](LICENSE) file for details.
## Disclaimer on the use of Artificial Intelligence
This project was made *entirely* using Claude Sonnet 4.0 and GPT 4.1. 100% of the code was AI generated and no human hand was involved other than prompting the Agent.
## Links
- [Example Gallery](https://etpwww.etp.kit.edu/~kschmidt/gallery/index.html)
## TUI Usage
The TUI is a terminal user interface built with [Textual](https://textual.textualize.io/). It lets you edit the configuration and trigger generation without leaving your terminal.
```bash
gallery tui
```
## Configuration
The config file lives at `$HOME/.config/gallery/config.yaml` by default. You can point to a different file with `gallery --config /path/to/config.yaml `.
### Config structure
```yaml
paths:
web_folder: "/web/user/public_html" # required
gallery:
plot_root: "gallery" # subdirectory inside web_folder
png_dpi: 400 # thumbnail resolution
sources:
- name: "analysis_results"
path: "/path/to/plots/directory"
- name: "specific_plot"
path: "/path/to/another/directory"
metadata:
cache_enabled: true
inherit_from_parent: true
```
### Metadata Files
Create `metadata.yaml` files in your source directories. Fields are arbitrary and rendered via YAML object interpretation (dict, list, …). Lower-level files override parent values, which is useful for labelling specific experiments.
```yaml
# metadata.yaml
title: "Analysis Results"
description: "Results for my analysis"
experiment: "CMS"
dataset: "Run2_2016_nano_v9"
parameters:
luminosity: "35.9 fb^{-1}"
center_of_mass_energy: "13 TeV"
selection: "baseline"
tags:
- "physics"
- "analysis"
- "cms"
authors:
- "Researcher A"
- "Researcher B"
```
LaTeX formulas are supported in metadata values and rendered with MathJax:
```yaml
formula: "$$E = mc^2$$"
```
## Producing Plots with `plotstyle`
`plotstyle` is a companion matplotlib styling toolkit shipped in this repo (the `plotstyle/` package) for producing the plots you'll point a gallery source at — a KIT (Karlsruhe Institute of Technology) corporate-design color palette, consistent spines/ticks/gridlines, LaTeX text in a modern sans font, and a few building-block functions (figure titles with a parameters subtitle, a same-size colorbar helper, an outside-axes legend, panel labels). It has no code dependency on `gallery` — the two only meet on disk, through the PDF files (and optional `metadata.yaml`) a `plotstyle` script writes into a directory that `gallery` then scans.
Install it with the `plotting` extra (see [Installation](#installation)) and make sure a LaTeX toolchain (`latex` + `dvipng`) is available locally — `plotstyle` always renders text through real LaTeX, there's no fallback.
```python
import numpy as np
import plotstyle as ps
ps.use() # once, before creating any figure
fig, ax = ps.new_figure(
"thesis-single",
title="Measured signal",
params={"N": 512, "seed": 42},
)
x = np.linspace(0, 10, 200)
ax.plot(x, np.sin(x), label="signal")
ax.set_xlabel("Time (s)")
ax.set_ylabel(r"Amplitude $A(t)$")
ps.style_legend(ax, title="Series")
# Save straight into a gallery source directory:
ps.savefig(fig, "/path/to/plots/measured_signal", formats=("pdf",))
```
That PDF (plus an optional `metadata.yaml` next to it, as described above) is exactly what `gallery generate --source /path/to/plots` picks up — `gallery` converts the PDF to a thumbnail PNG itself, so `plotstyle` scripts should stick to `formats=("pdf",)` rather than also producing a PNG.
See `examples/plotstyle_showcase.ipynb` for a fully rendered tour of every function, and `plotstyle/CLAUDE.md` for the full API reference and best practices (aimed at coding agents, but equally useful for humans).
## Shortcuts
| Icon | Button | Function | Shortcut |
|------|---------|--------------------------|----------|
| 🔍 | Search | Real-time plot search | `Ctrl+K` |
| 📋 | Recent | Recently viewed plots | `Ctrl+R` |
| ⚖️ | Compare | Side-by-side comparison | `Ctrl+C` |
| ☀️ | Theme | Toggle dark/light theme | `Ctrl+T` |
## Troubleshooting
### Common Issues
| Issue | (Potential) Solution |
|------------------------------------|----------|
| `gallery` command not found | Run `pip install -e .` from the repo root |
| PDF conversion fails — no renderer | Install PyMuPDF: `pip install pymupdf` (or `apt-get install imagemagick` as fallback) |
| PDF conversion fails — corrupt file | Verify the PDF opens in a viewer; try `pip install --upgrade pymupdf` |
| Permission denied on web dir | Check file permissions and web directory access |
| Metadata not showing | Check YAML syntax with `python -c "import yaml; yaml.safe_load(open('metadata.yaml'))"` |
### ImageMagick memory limits (fallback backend only)
```bash
export MAGICK_MEMORY_LIMIT=2GB
export MAGICK_MAP_LIMIT=2GB
gallery generate --verbose
```
## License
This project is licensed under the MIT License — see the [LICENSE](LICENSE) file for details.
## Disclaimer on the use of Artificial Intelligence
This project was made *entirely* using Claude Sonnet 4.0 and GPT 4.1. 100% of the code was AI generated and no human hand was involved other than prompting the Agent.
## Links
- [Example Gallery](https://etpwww.etp.kit.edu/~kschmidt/gallery/index.html)